Blog
Reducing Quarto file sizes with gzip compression in R and Observable JS
How easily you can do quite complex things in R again and again baffles me. In this post, I share the 12 lines of git2r and ggplot code that it takes to create a wordcloud of your Git commits.
Shuffling my Spotify Liked Songs or: checking my assumptions
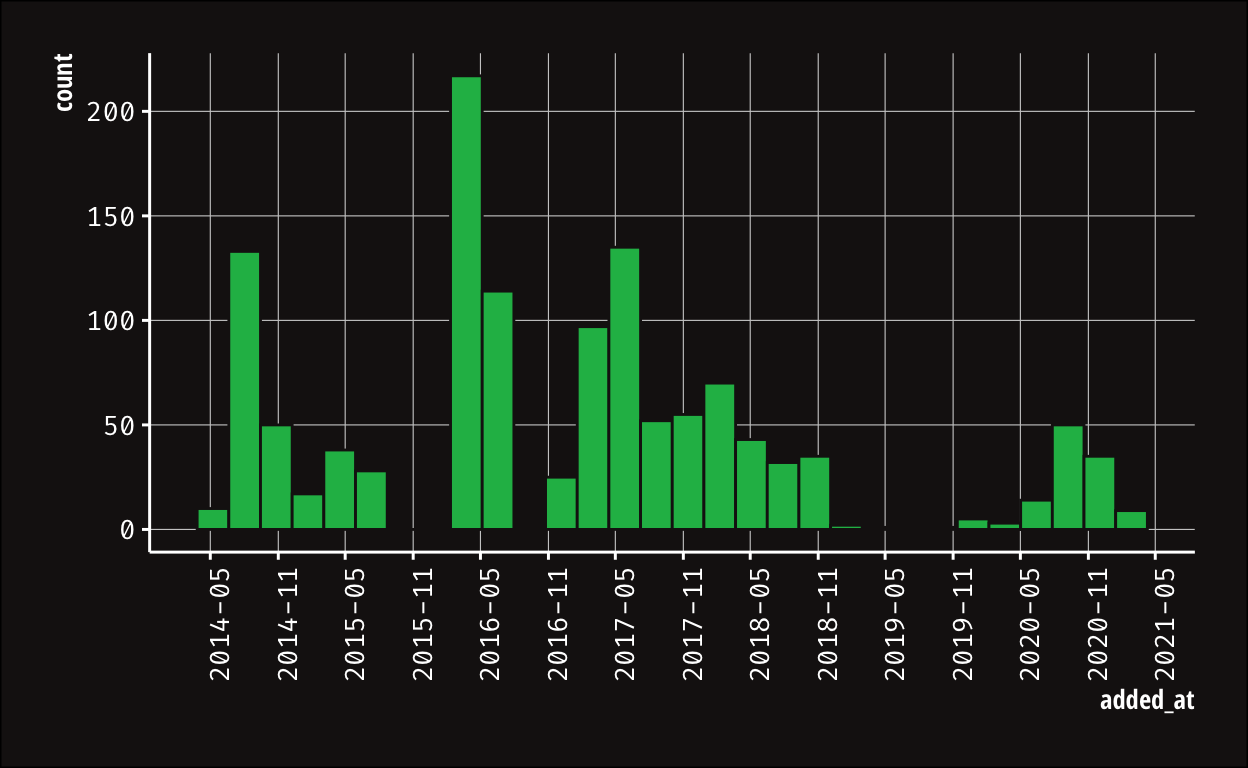
In this post I tell the sad story of how I spent hours coding before realizing my core assumption was wrong.
Analyzing my 2020 GitHub commits with R and GraphQL
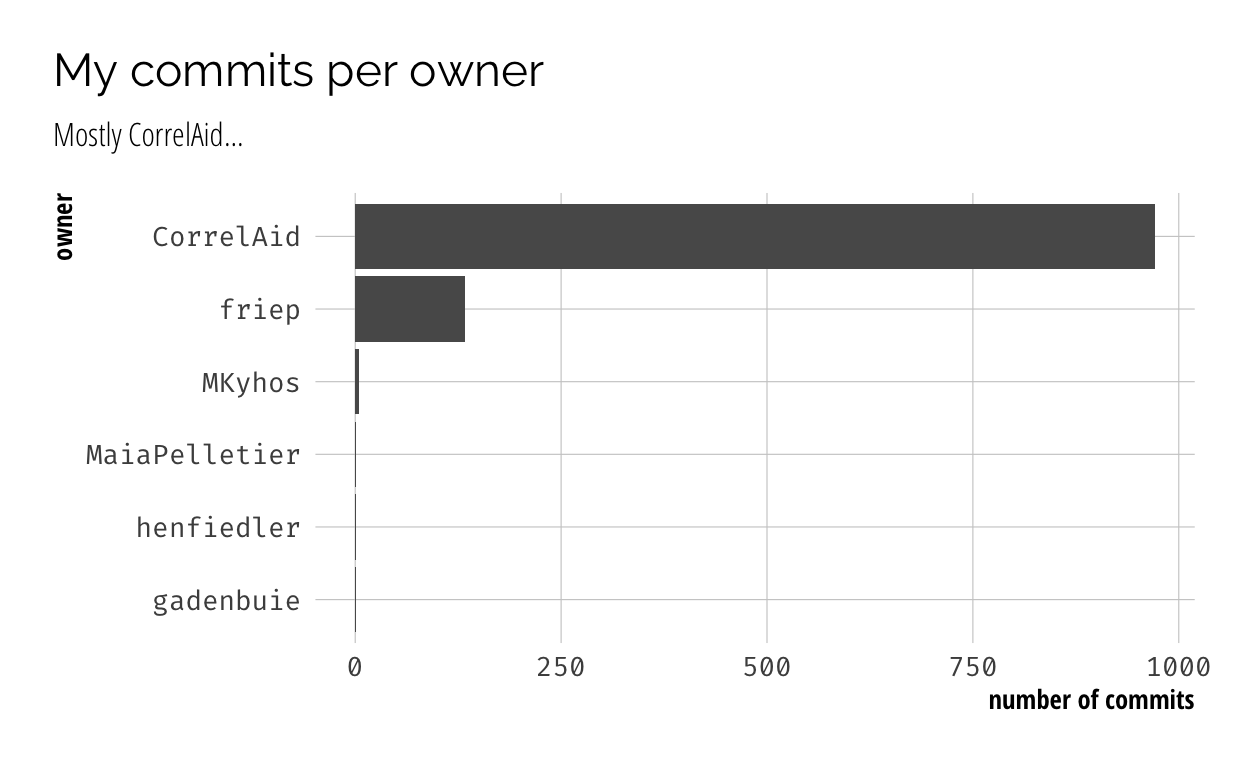
I show you how to use R and the GitHub GraphQL API to collect all your commits in 2020. I use this data to answer the important question: "Are 30% of my commits one-line diffs?"
Misc tricks when migrating from blogdown to distill
Some small things I learned as I migrated my blog from blogdown to distill.
Create a Wordcloud of your Git Commits with R
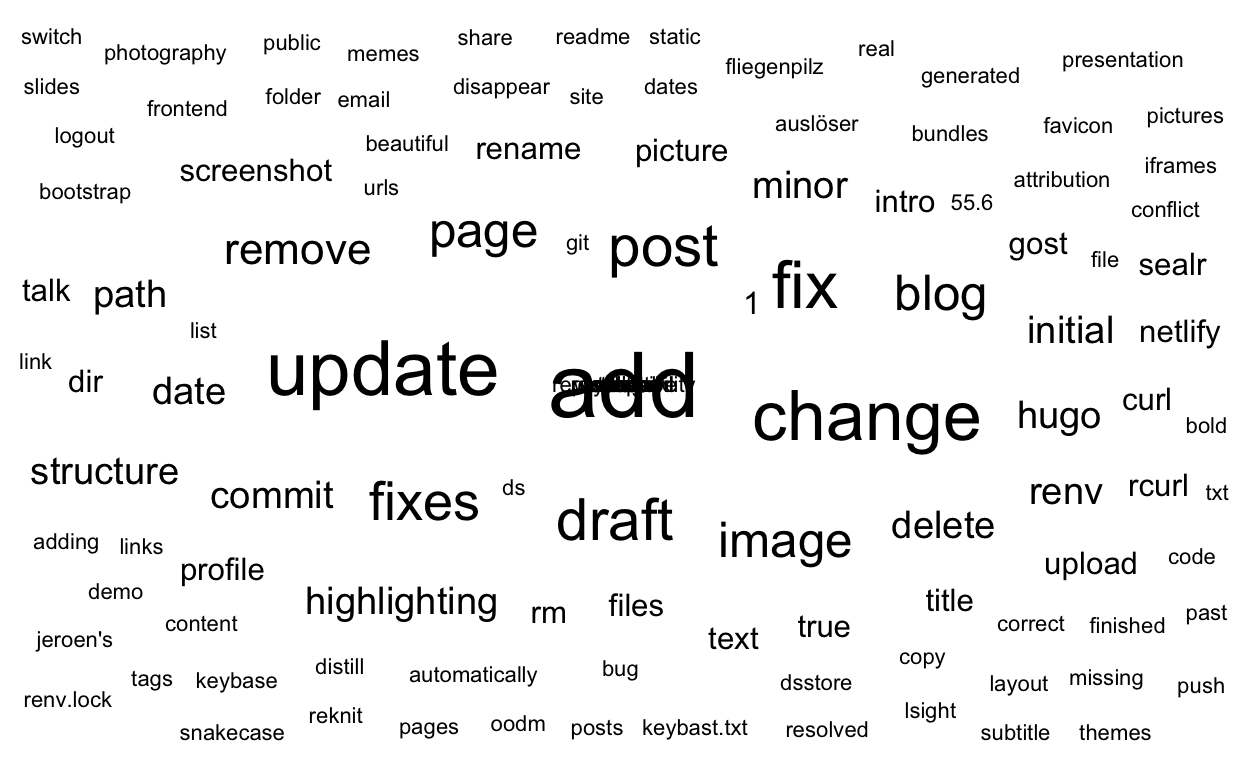
How easily you can do quite complex things in R again and again baffles me. In this post, I share the 12 lines of git2r and ggplot code that it takes to create a wordcloud of your Git commits.

How to use R to remove audiobooks from your Spotify liked songs
I walk through my process of using R's purrr, spotifyr and httr to remove unwanted content from my Spotify liked songs playlist.
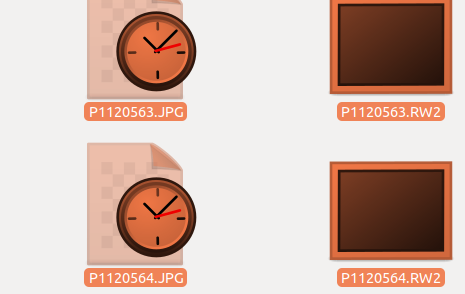
Automate the boring stuff of your amateur photographer life
Being able to program makes you lazy - or rather it gives you the ability to be lazy by just automating everything. This is what I did in this post.

Migrating a Hugo + Netlify blog from GitHub to GitLab
I walk you through the process of migrating my blog from GitHub to GitLab. No code, just a lot of screenshots.
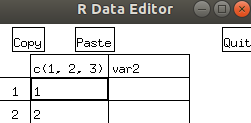
My old R scripts: 1. Einfuhrung in R (R Code) (1).r
I have a look at the oldest R script on my laptop and then realize half way through that I have not written it myself. Still major #throwback vibes and a lot of wtf moments.

curl vs RCurl or: how to choose a package
In the first entry of the #dstexts series, I ditch old timer RCurl for the new, shiny curl and talk about my five criteria for choosing R packages.
Introducing this blog
I talk about how Twitter forced me to start a blog and the two ideas I have for it.